-01.png)


1. Making Sense Of The Funnel: Where Each Metric Actually Belongs
I usually group campaigns into three broad stages:
- Awareness
- Traffic
- Conversion
For each stage, I separate:
- Performance metrics: is the campaign doing the job it is supposed to do at this stage. Examples of performance metrics include: Click through rate (CTR), Conversion rate (CVR). More on those later.
- Cost metrics: how expensive it is to achieve that performance. Examples of cost metrics include: Cost per click (CPC), Cost per Conversion- Basically any metric that starts with “cost per”. More on those later as well.
The combination of performance and cost is what tells me whether to fix or scale.
2. Awareness: Are The Right People Even Noticing You
Goal: reach the right people and get noticed
Awareness campaigns are usually optimised for reach, video views or engagement. The job here is not to get purchases. The job is to get in front of the right people and make sure they actually notice you.
2.1 Performance metrics for awareness
For performance, I look at:
- Impressions and reach
- Frequency (Impressions divided by reach)
- Hook or thumb stop rate for video (for example 3 second views divided by impressions)
- View through rate or percentage of video watched
The question I am trying to answer:
When people see this ad, do they pause for a moment or just scroll past
If performance is healthy, I should see:
- A reasonable proportion of people watching past the first 1 to 3 seconds
- Frequency that is not too low (no reach) and not too high (ad fatigue)
2.2 Cost metrics for awareness
For cost, I mainly look at:
- Cost Per Mille (CPM) (Cost divided by impressions divided by 1,000)
- Cost per 3 second view or cost per ThruPlay for video first campaigns
Here the question is:
How much are we paying to buy attention from this audience
2.3 How I interpret awareness performance vs cost
I normally think in four simple patterns:
- Strong performance, acceptable cost
- People are watching or engaging with the ad
- CPM and cost per view are within a comfortable range
- I usually keep this running and only touch it if I see problems further down the funnel
- People are watching or engaging with the ad
- Strong performance, high cost
- The creative is doing its job but the audience is expensive
- I tend to keep the creative angle and test broader or alternative audiences, geographic locations, placements. (More on audience targeting in my detailed article here.)
- Avoid peak advertising seasons like 11.11 or black friday if they don’t matter to your business to see if cost can come down
- The creative is doing its job but the audience is expensive
- Weak performance, low cost
- Cheap impressions but low hook rate or view rate = The ads are not effective in getting your message out there
- I focus on improving the creative first: stronger hooks, clearer pain points, more relevant visuals. (I have written an entire Meta Ads Creative Testing Playbook here on how to fix this).
- Cheap impressions but low hook rate or view rate = The ads are not effective in getting your message out there
- Weak performance, high cost
- Hard to reach people and they are not paying attention
- This usually signals a more fundamental mismatch in both targeting and creative, so I treat it as a major fix rather than a small tweak
- Test a different creative with the original audience, and test the same creative with a few different audiences to see which combination improves results
- Hard to reach people and they are not paying attention
3. Traffic: From Scroll To Click And Onto Your Site
Goal: turn interest into site visits
Traffic or link click campaigns are about getting people off the platform and onto a landing page or store. This is where click performance and click cost become very clear.
3.1 Performance metrics for traffic
Performance for traffic is mainly:
- (Link) Click through Rate (CTR) (clicks divided by impressions)
- On-site behaviour from web analytics
- Bounce rate or Engagement rate
- Session duration or Time on site
- Pages per session
- Bounce rate or Engagement rate
The main question:
Out of the people who saw the ad, how many were interested enough to click, and are those clicks at least somewhat qualified (rather than accidental)
Healthy performance usually shows up as:
- CTR close to or above your internal benchmark (more on that later)
- On-site behaviour that indicates they are reading and browsing instead of clicking away immediately
3.2 Cost metrics for traffic
For cost, I look at:
- Cost per click (CPC)
- Cost per landing page view or cost per unique visitors
This tells me:
What does it cost to get one person onto the site
3.3 How I interpret traffic performance vs cost
Here is how I usually read the combinations:
- High CTR, low CPC
- People like the offer and each click is relatively cheap
- If conversions are also healthy, this is a very strong sign
- I tend to keep this setup running and consider it as a potential candidate for scaling
- An extra step to check before scaling such traffic campaigns is your web quality performance metrics:
- If the web quality is strong, this means you’re getting cheap clicks that are also strong in quality and are users who are interested in your brand.
- If web quality is poor, this could mean that the ads people are clicking doesn’t relate or tie in well with your website, resulting in drop-offs and poor website engagement. Try tweaking either your website and/or your ad to have better alignment.
- People like the offer and each click is relatively cheap
- High CTR, high CPC
- The message is working, but the audience or structure is expensive
- In this situation, I protect the winning creative and angle, and instead test other audiences, locations, placements or bidding setups to bring CPC down. (More on audience targeting in my detailed article here.)
- I temporarily pause or scale down campaigns during peak advertising cost periods (eg. 11.11, black friday, etc) if not relevant to my brand
- Adding in click cost caps will help to bring down the costs as well
- The message is working, but the audience or structure is expensive
- Low CTR, low CPC
- Clicks are cheap when they happen, but not many people click relative to impressions
- This often means the ad is too generic or not clearly relevant
- I focus on sharpening the positioning, making the promise clearer and speaking more directly to a specific segment. (I have written an entire Meta Ads Creative Testing Playbook here on how to find the right creative for your audience).
- Clicks are cheap when they happen, but not many people click relative to impressions
- Low CTR, high CPC
- Expensive impressions with a poor click rate
- Both sides (targeting and messaging) are not working
- I treat this as a major fix situation and rework both audience and creative approach rather than trying micro changes
- Expensive impressions with a poor click rate
4. Conversions: Where Clicks Turn Into Revenue
4. Conversions: Where Clicks Turn Into Revenue
Goal: turn visits into leads, bookings or sales
Conversion campaigns are where results translate into revenue. This is where I connect everything back to the business model.
4.1 Performance metrics for conversions
For performance, I look at:
- On-site conversion rate
- Lead form completion rate
- Add to cart, initiate checkout, purchase rate for ecommerce
- Lead form completion rate
- Lead or customer quality
- Lead to sale or lead to show up rate
- Any consistent issues with refund or churn for certain offers
- Lead to sale or lead to show up rate
- Revenue metrics
- Average order value
- Revenue per visitor
- Average order value
The key question:
When people land on the page, do they actually take the action we care about, and is the quality acceptable
4.2 Cost metrics for conversions
For cost, I focus on:
- Cost per lead (CPL) or Cost per Acquisition (CPA)
- Customer acquisition cost (CAC)
- Return on ad spend (ROAS)
This is where I look at whether the numbers make sense against margins and lifetime value.
4.3 How I interpret conversion performance vs cost
Common patterns I see:
- Good conversion rate, good CPL or CPA and ROAS
- The funnel is aligned: traffic quality, offer and page are working together
- I treat this as a winning setup and start thinking about controlled scaling
- The funnel is aligned: traffic quality, offer and page are working together
- Good conversion rate, weak CPL or CPA or ROAS
- Page and offer work, but traffic is too expensive
- The bottleneck is earlier in the funnel at awareness or traffic stage. I focus on lowering CPM and CPC without touching the core of the offer and page (more on that later in How To Troubleshoot Weak Performance)
- Page and offer work, but traffic is too expensive
- Weak conversion rate, good CPC and CPM
- Traffic is affordable and people are clicking, but once they land on your site, they do not convert
- This points to an offer, landing page or overall funnel issue
- The offer or product may not be attractive enough or
- The landing page is not well designed to convince the user of your brand’s proposition or
- The ads you’ve served are conveying a different messaging from your landing page, resulting in a disconnect
- I work on improving the page, clarifying the promise, strengthening proof and reducing friction
- Traffic is affordable and people are clicking, but once they land on your site, they do not convert
- Weak conversion rate, weak CPL or CPA and ROAS
- High cost and poor performance at the same time
- This usually needs a more fundamental review of audience fit, offer design and sales process, not just ad tweaks- which leads me to my next section- How To Troubleshoot Weak Performance
- High cost and poor performance at the same time
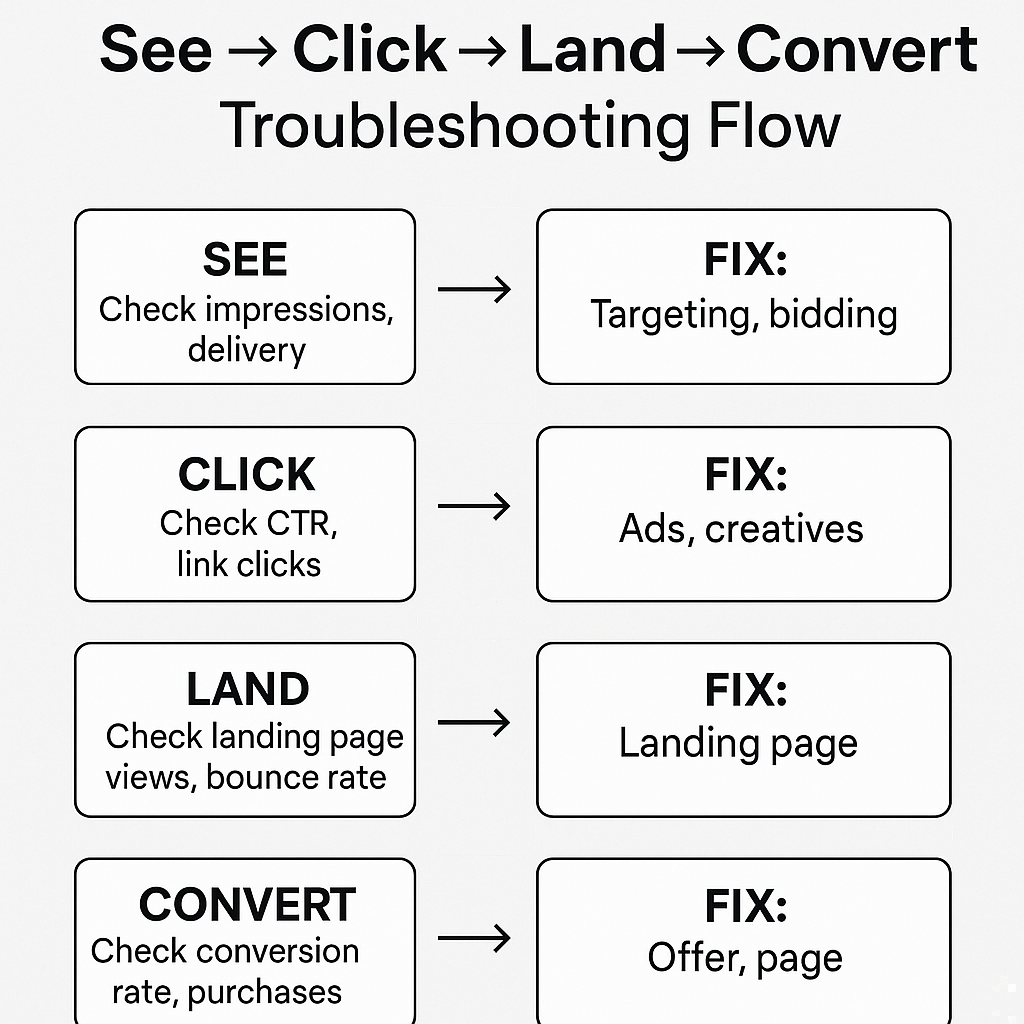
5. How To Troubleshoot Weak Performance: The See → Click → Land → Convert Flow
Everything you have read so far looks at metrics by funnel stage. The See → Click → Land → Convert flow is the same idea, just zoomed in to a single user journey so you can troubleshoot in the right order.
One of the most common mistakes I see from new business owners and junior marketers is that they look only at conversions. When results are bad, their first thought is, “The landing page is not working” or “The offer must be weak.”
But conversions sit at the very end of a sequence. Before someone converts, four things must happen in order:
- They must see the ad
- They must click the ad
- They must land on the page properly
- They must convert on the page
If any step breaks, the steps after it will also break.
That is why I always run through this flow whenever performance looks off.
Step 1: Did people actually see the ad
Start with impressions and delivery. If the ad did not serve properly, you cannot judge any other metric.
Typical causes when impressions are low:
- Audience is too narrow
- Too many delivery restrictions (manual placements, too many filters, tight geos)
- Budget is too small for the auction
- Learning phase resets, limited learning labels or delivery conflicts
If the ad is not serving, fix delivery and targeting first. (More on audience targeting here.) There is no point analysing CTR or conversion rate if people simply never saw the ad.
Step 2: Did people click the ad
If you have impressions but CTR is weak, then the issue is not delivery.
The issue is that people saw the ad but were not interested enough to click.
This usually signals:
- Weak hook or visual
- Unclear promise
- Misaligned angle for the chosen audience
- Low relevance or broad, unfocused messaging
If people see the ad but do not click, fix the attention problem first. (Check out my Meta Ads Creative Testing Playbook here on how to fix this.)
Until you get consistent quality clicks, you do not have enough traffic to judge the landing page.
Step 3: Did people land on the page
This is the layer most people skip.
You can have a decent CTR, but if landing page views are low, website engagement rates are low or bounce rate is extremely high, you are not dealing with a conversion issue yet. You are dealing with a click quality or landing experience issue.
Common issues here:
- Slow or heavy landing page
- Page layout mismatched with the ad promise
- Technical or tracking problems
- Confusing first fold content
If clicks do not turn into meaningful page visits, fix the landing experience before touching the offer or page content.
Step 4: Did people convert
Only when the ad serves well, CTR is healthy and page visits look stable should you judge conversion rate.
If conversion rate is low despite good traffic quality, the issue usually sits in:
- Offer strength
- Clarity of the value proposition
- Social proof or credibility
- Friction in the form or checkout
- Pricing or perceived value
Fix the offer and landing page only when the previous layers are stable.
Otherwise you are optimising the wrong variable.
6. Benchmarks And Testing Thresholds: How Much Data Is Enough To Trust Your Numbers
Once you know where the funnel is breaking and which step of See → Click → Land → Convert is weak, the next question is simple: are the numbers actually bad, or are they just early. That is where benchmarks and testing thresholds come in. Without them, it is hard to know what “good”, “borderline” and “bad” actually mean.
6.1 Define the primary outcome for the account
First, I decide the main outcome for the account or campaign. These are usually conversion level metrics. For example:
- Lead generation
- Target cost per lead
- Target cost per qualified lead
- Target cost per lead
- Ecommerce
- Target ROAS
- Target CAC
- Target ROAS
This outcome is the north star I come back to when daily numbers move around.
6.2 Set working benchmark ranges
You need something to compare your current campaigns to in order to determine if it’s good or bad. The best benchmark is your historical data. Use data for similar campaigns (objective, time of the year, product, ad format) to give yourself a baseline. When comparing within ongoing campaigns, you should also compare within the campaign across adsets/ ads and the campaign average.
If you do not have past performance (e.g. you’re just starting out, or you have yet to try a certain campaign objective/ format), use industry benchmarks for your locality (city/ country). But once you start getting your own data, switch over to using your historical data as a stronger benchmark for your performance.
These do not need to be perfect benchmarks. They just need to be realistic enough so you can identify whether your campaigns are fine or clearly a problem.
Refine your benchmarks as you go along and gain more insights as media costs and algorithms are always changing!
6.3 Ensure you have the minimum data needed before you judge
Finally, I set minimum thresholds so I do not overreact to small samples. You need a minimum amount of data because Meta’s algorithm learns through patterns, not isolated events. With too few impressions, clicks or conversions, the system is still guessing, which makes early performance unstable and unreliable. Hence you need to set some minimum data thresholds before evaluating your campaign against your benchmarks. For example:
- Awareness
- To optimise for awareness campaign performance, ads are generally analysed and optimised at an impression threshold for 1,500- 3,000 per ad, usually after 7 days.
- To optimise for awareness campaign performance, ads are generally analysed and optimised at an impression threshold for 1,500- 3,000 per ad, usually after 7 days.
- Traffic
- To optimise for traffic campaign performance, ads are generally analysed and optimised at a threshold of 1,500-3,000 impressions or 20 clicks per ad, whichever threshold is reached earlier.
- To optimise traffic quality metrics, the threshold for landing page sessions is usually 20-30 sessions (excluding testing sessions driven by the ad platforms bots, which are usually 10-20 sessions)
- Conversion
- Unlike awareness and traffic campaigns, to optimise for conversion campaign performance, there are more considerations in setting an impression/ click threshold as the conversion rates vary significantly depending on the type of conversion. The higher the effort for the desired action, the lower the conversion rate.
- Generally, the conversion threshold to evaluate an ad’s performance is 5-10 conversions, while the click threshold is the 5-10 conversions divided by the average/ historical conversion rate. For example, for a historical conversion rate of 1%: the click threshold would be 5 to 10 ÷ 1%, i.e. 500 to 1000 clicks.
- You can adjust these numbers to your spend level, but the goal is the same:Give the algorithm enough space to work before you decide to fix, test or scale.
 Mike's Tip:
Mike’s tip: Instead of checking back every few hours on whether your ads have hit the minimum data thresholds in testing, use Meta Ad’s automated rules to either remind you or make optimisation actions for you. More on automated rules in my article 5 Simple Ways to Boost Your Meta Ads for eCommerce Growth